Visualizing networks and careers
We mostly post map visualizations of our historical data on sailors, but we’re working on other visualizations to gain insight into our data as well.
Markov models
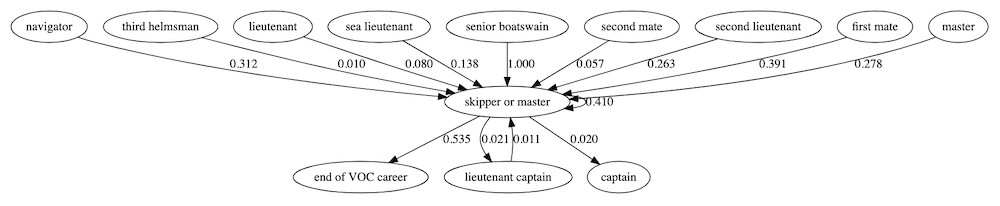
We’ve teamed up with DHLab and Marijn Koolen (@marijnkoolen) of the KNAW-Humanities Cluster to do a thorough analysis of sailor’s careers. As a first step, Marijn produced Markov model visualization of all steps in the career data we reconstructed from the digitized VOC pay ledgers. These visualizations give very good insight into the data. The one pictured below, for example, shows the various ranks from which crew members were promoted to ‘skipper or master’ and the most frequent career steps after having served as a ‘skipper or master’ on a Dutch East Indiaman (most often: ‘end of VOC career’). It also suggests that senior boatswains always climbed up in the hierarchy to become a skipper. This is a remarkable fact, even though we have only four senior boatswains in our career clusters. Thanks to this visualization, we now know that we need to look into our data again to find out whether senior boatswains were indeed without exception very highly skilled, or that something is wrong with these clusters.
Network visualizations
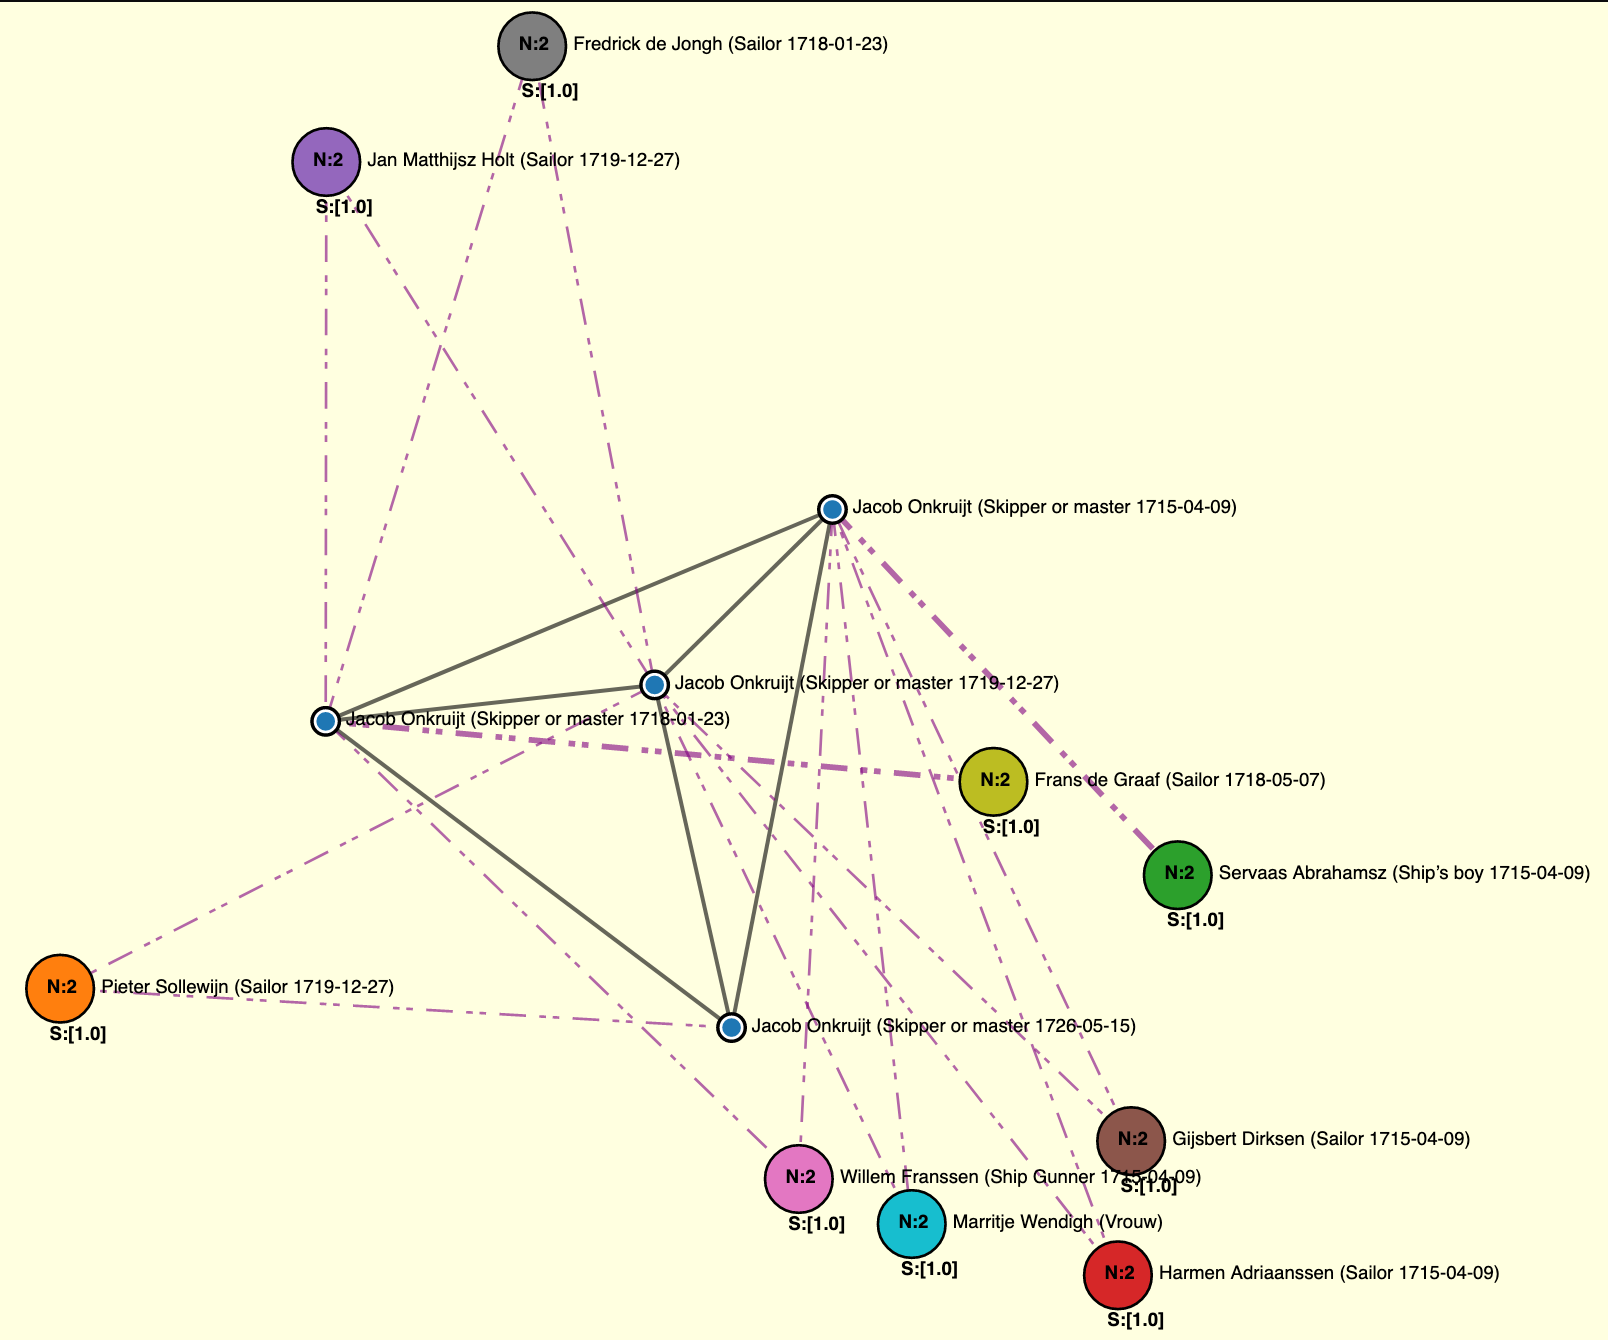
We’re also working together with Veruska Zamborlini and Al Idrissou. They are experts on automated methods for linking entities from various datasets and subsequently validating the links. We did a pilot on our VOC career data to see if we could devise a way to automatically validate our career reconstructions, which consist of multiple observations from the digitized VOC pay ledgers: is our clustering correct, or did we sometimes wrongly link observations to one individual?
We experimented with networks around captains. They were the highest officials on board and had a significant say in the hiring of crew members. Our hypothesis was that it is likely that a captain would hire sailors that he’d sailed with on an earlier voyage to the East Indies, and that these recurring patterns would help us to validate clusters. Veruska and Al produced network visualizations like the one pictured below. So far, alas, evidence from the network analysis is too sketchy. But the experiment has inspired us to test other crew network hypotheses, so there’s more on this to come.