Visualizations
-
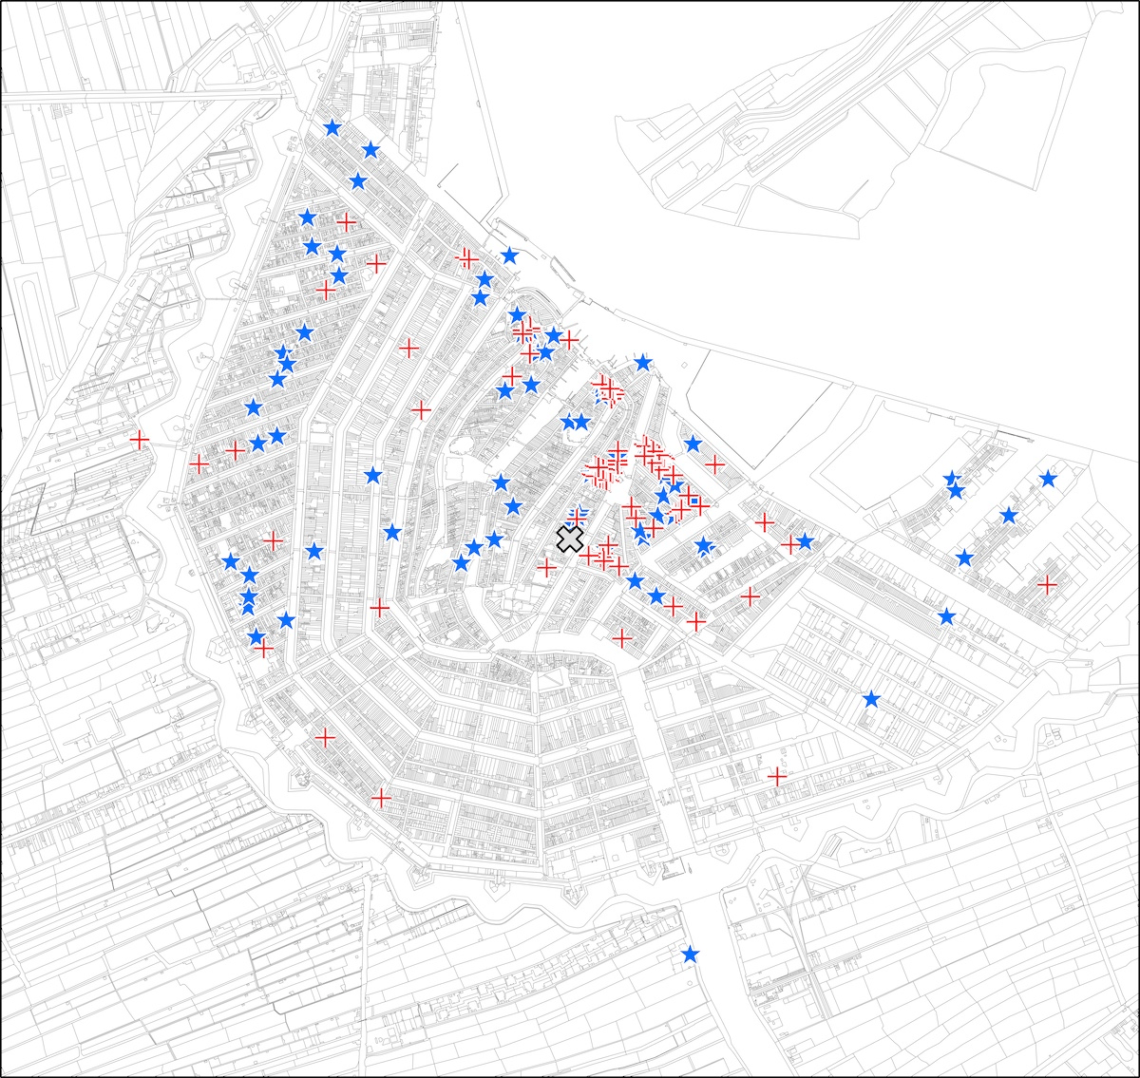
VOC Sailors’ Last Days in Europe
Our new Dutch-language book, In de schaduw van de stad (Amsterdam: Ambo|Anthos 2023), which tells a series of short stories about ‘ordinary’ Amsterdammers through the ages, includes a chapter on sailors. We researched the crew members of three VOC ships that left Amsterdam in November 1775: who were they, where did they come from, where did they live or stay in Amsterdam? It was known that inns played an important role in the lives of many aspiring VOC sailors by providing a place to stay and information about finding work with the VOC. And it was also known that this was especially true for migrants. But we were surprised when…
-
Where Dutch seafarers on Belgian merchant vessels came from (1845-1885)
In an earlier post, our colleague Kristof Loockx, postdoctoral researcher at the University of Antwerp, wrote about the Antwerp seamen’s registry–a great source for maritime historical research. In this post, he takes a closer look at the Dutchmen in this registry: where in the Netherlands did they come from? Foreigners in the Antwerp seamen’s registry During the nineteenth century, there were never enough Belgian seafarers to meet the demand for labour of the Belgian merchant fleet. The Belgian merchant marine therefore relied heavily on foreign labour. In general, the ratio of Belgian to foreign seafarers was about 1:2 in the middle of the century, and 1:2.8 in 1890. We know…
-
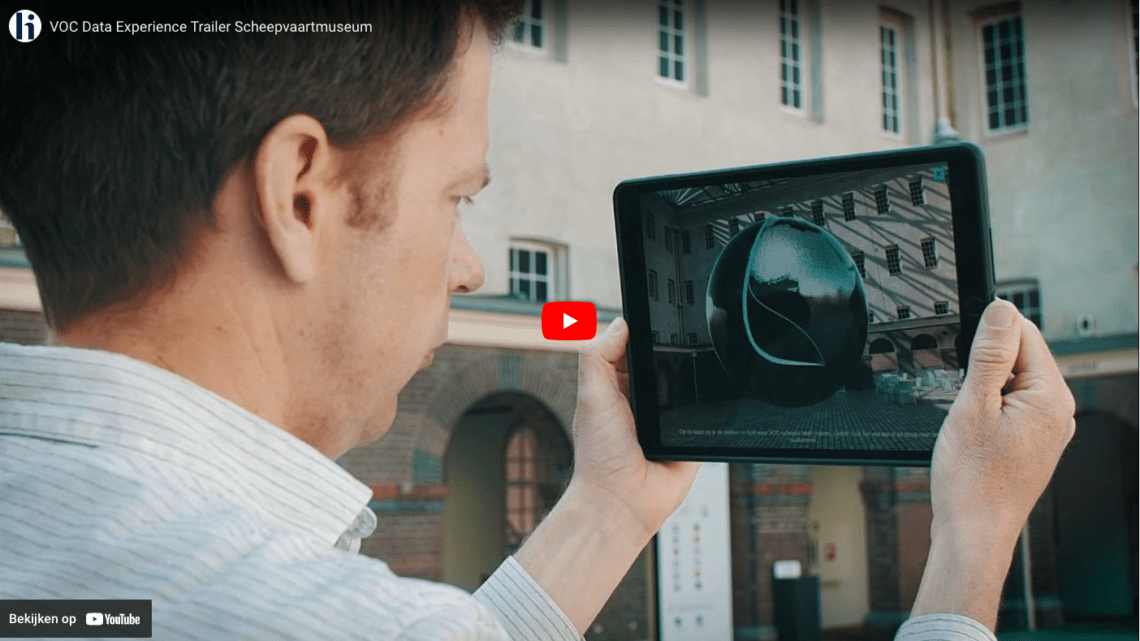
VOC Data Experience
We have frequently written on this site about our research on the crews of the VOC. In the VOC Data Experience, this data now comes to life with spectacular visualisations in augmented reality (AR). Click on the image below to watch the trailer. Six experiences in AR The VOC Data Experience starts with a cloud of names of hundreds of thousands of crew members of the Company’s ships. More information is available about each of these individuals. There are also six thought-provoking experiences. In each of these, a theme is highlighted using original data from the VOC. Data expert Lodewijk Petram, together with different heritage specialists or researchers, explain and…
-
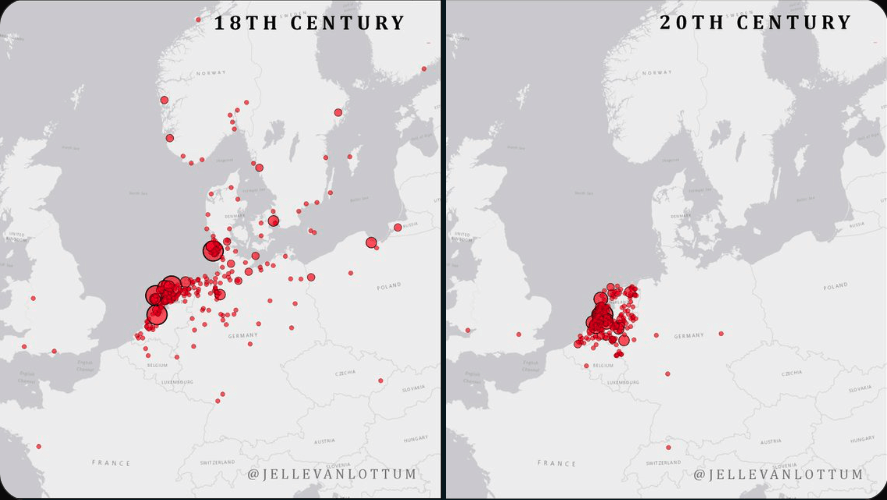
First results from our project on the recent history of merchant marine sailors
We can show some first results from our recently started project on sailors aboard Dutch merchant marine ships in the 19th and 20th centuries. Researcher Daniël Tuik has been working on a sample of personnel records from the archives of the Koninklijke Nederlandse Stoomboot-Maatschappij (KNSM), a shipping company that was based in Amsterdam. He tells more about his work in another blog post. The map on the right in Jelle’s tweet shows the birthplaces of KNSM crew members in the 20th century, mainly sailing on trans-Atlantic routes, while the one on the left shows where the sailors came from who appear in the Prize Paper dataset, which also mainly contains…
-
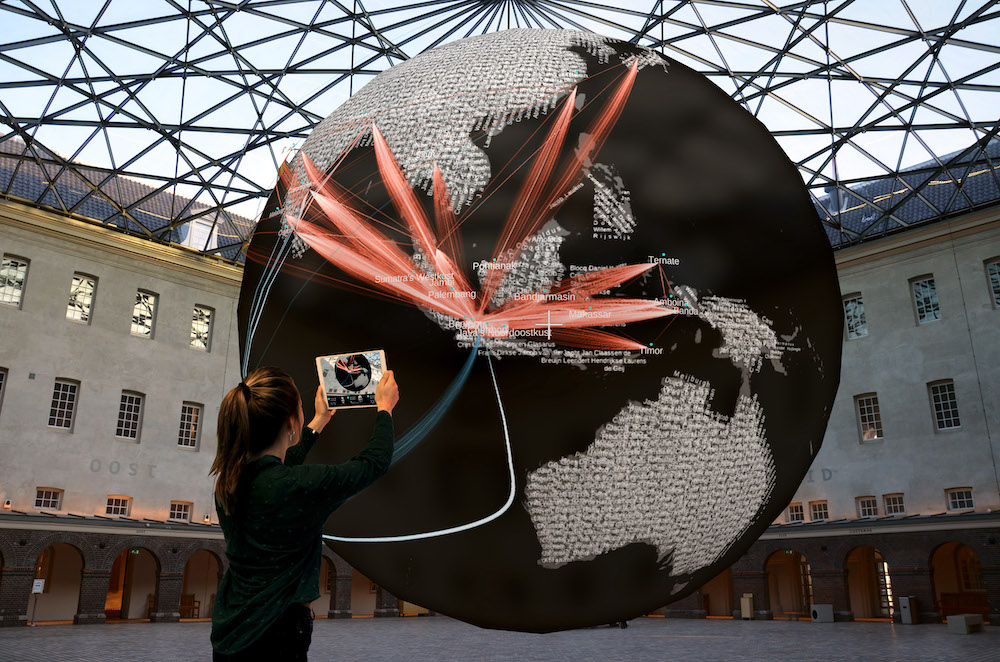
Our research soon visible in augmented reality
Together with Dirk Bertels / Studio Louter we have been awarded a subsidy from the Creative Industries Fund NL under the Digital Heritage x Public scheme to build the VOC Data Experience. Visitors to the experience can explore three existing online data sets about the Dutch East India Company (VOC) in augmented reality (AR). In the VOC Data Experience we will unlock three digitized VOC sources for a broad audience in a stimulating way. Visitors will be able to literally ask questions to the crew members of the VOC on an iPad: Where did you come from? What was your chance of survival? Did you participate in the slave trade? To find…
-
Women sailors in the ranks of the Dutch East India Company
Last week, Jelle tweeted about the women who dressed up as men to land a job with the VOC and were fired when subsequently their ‘real’ gender became known. Several people have asked for more information, in particular about the origins of the women involved. Below is a spreadsheet that lists their (for obvious reasons fake) names, and their place of origin – all other information available about the individuals are also listed. As you can see in the ‘remarks’ column, there are some really interesting cases: a woman going by the name of ‘Hendrik Huijsloop’ married a fellow sailor on board the Petronella Alida, and the ‘Joannes Burghart’ case…
-
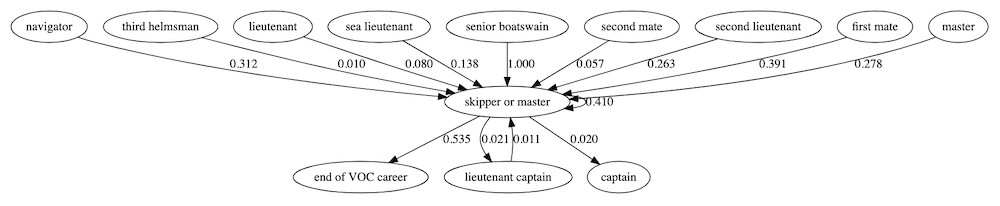
Visualizing networks and careers
We mostly post map visualizations of our historical data on sailors, but we’re working on other visualizations to gain insight into our data as well. Markov models We’ve teamed up with DHLab and Marijn Koolen (@marijnkoolen) of the KNAW-Humanities Cluster to do a thorough analysis of sailor’s careers. As a first step, Marijn produced Markov model visualization of all steps in the career data we reconstructed from the digitized VOC pay ledgers. These visualizations give very good insight into the data. The one pictured below, for example, shows the various ranks from which crew members were promoted to ‘skipper or master’ and the most frequent career steps after having served…
-
Daniel Engel: a maritime career reconstructed
Daniel Engel was a young man from ‘Dantsig’ (modern-day Gdańsk in Poland) who travelled to the Dutch Republic in the mid-18th century to apply for a job with the Dutch East India Company (VOC). We’ve written about him before (in this blog post, where we introduced the Company’s pay ledgers, one of our main data sources) and now come back to him once more. Not that Engel is so special–on the contrary, there were thousands of men like him in the ranks of the VOC–but because his story is a good case in point for illustrating our work on reconstructing maritime careers. 1766: first journey to the East Indies A…
-
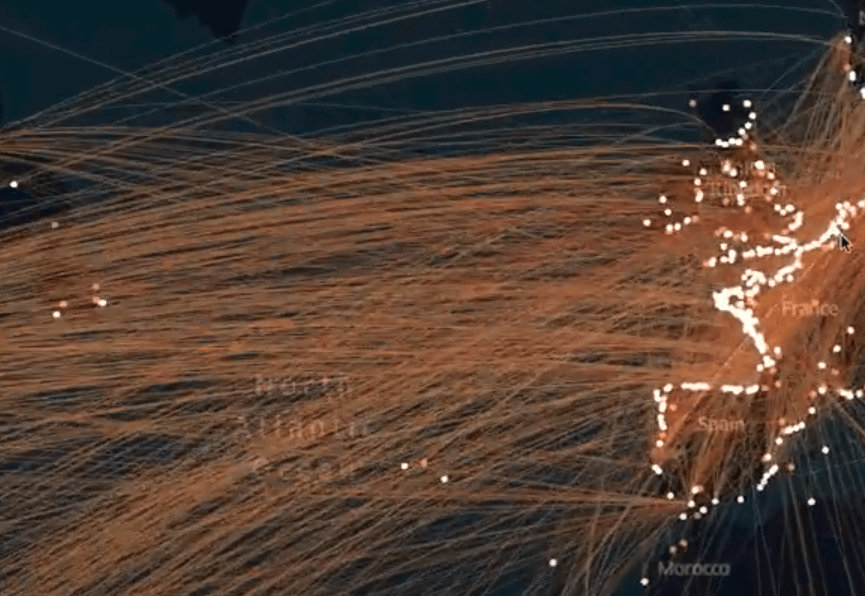
Walking through the Prize Paper Dataset
This video provides a tour through the Prize Paper dataset using Kepler. Kepler is an amazing open source geospatial analysis tool for large-scale data sets. Here I’ve used it get an impression of the geographical scope of the Prize Paper Dataset – focusing on the shipping connections. Every line represents the journey of an 18th century merchant ship. As you can see the main connections are intra-European and Transatlantic. We’ll make the dataset available (hopefully) sometime early next year. Please look at my twitter feed for any updates and other visualisation (maps in particular), using this dataset.
-
Elsevier article on geographical spread VOC crew members
Dutch weekly Elsevier published an article about our work on the birthplaces of the sailors who worked on the Dutch East India Company’s ships.